Monday, October 12, 2009

3D Shapes


We are learning about 3 dimensional shapes. We know that vertices's are the corners on a shape. A few shapes that have vertices's are a pyramid, a cube and a octahedron. An edge is the part along the side or end of a shape, and a face is one of the flat sides on a shape. we had lots of fun learning about 3 dimensional shapes.
By Ali and Jody.

2D Shapes

In this game, one person had to say the name of a shape and then they threw the ball to someone. That person had to describe the attributes of that shape. In the end we identified shapes within our very unusual shape!We found out some new shapes including rhombus and dodecohedron. by Solomon and Matt

Friday, October 9, 2009

Euler's polyhedron formula


Euler's polyhedron formula
Leonard Euler was a very famous French mathematician.We researched his theory for part of our homework.We found out that he resurected the theory that if you add the vertices and faces of a 3D shape then minus the edges the answer will always be 2.For example, using a cube, 8 plus 6 minus 12 equals 2.We all found this very interesting.
By Lili
Shared via AddThis

Monday, September 7, 2009

Perimetre and Area Reflections

I enjoyed measuring the gardens because it made a clear picture in my mind how to measure things to find the area.
Josh

How Much Soil Do We Need For Our New Gardens?


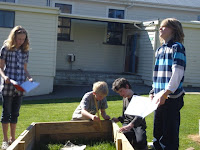
We have been lucky enough to get some brand new garden beds, but we needed to know how much soil to put into them. The length of the gardens was . We worked out we needed 1.8 cubic metres of soil for each garden. We cant wait for our gardens to be finished so that we can plant some plants in them!!
By Ali, Juliette and Jody, Cody, Josh, James, Bryn, Finn and Connor

Measuring the Perimetre of Our Garden Beds


Thursday, July 30, 2009

Length and Area

Length can be measured in millimetres (mm), centimetres (cm), metres (m) and kilometres(km).
Perimetre is when you measure around the outside of an object
Area is found by measuring the height x width x length. It is measured in mm3 cm3 or m3

We are learning to

Convert between metres , centimetres and millimetres
Use addition and multiplication strategies to find the length, area and perimetre of objects

Thursday, July 23, 2009

Time


We are learning about time including finding out how to convert digital time to analogue time and how to rename digital notation for a twelve hour clock and a twenty four hour clock.We are also learning how to solve problems involving time in using analogue and digital clocks.
Click on the websites on the right hand side of the blog to play the games.

Sunday, June 28, 2009

Finding the Volume of a Solid


The volume of an object is the amount of space that is inside it. This cuboid is 3 cubes high, 4 cubes in length and 2 cubes in width. ( 3 x 4 x 2 ) 24 cubes in total. We have been using our knowledge of multi[lication to find the volumes of different shapes.

Volume Reflections

I enjoyed making the cubes because I learnt how to multiply the width x the length x the height. Cody

I liked when we made pancakes because I learnt how to measure the volume of liquid. Oliver

I absolutely enjoyed when we made rice bubble cakes.I liked that I got to make and measure it at the same time.I enjoy multitasking,it helps me think and it perks my brain up.
Bryn.

I really enjoyed making cubes because I like mulitpliying.I also like making piklets.
Dylan.E.

I really loved trying to make the right cuboids
Barney

I really enjoyed making piklets. They were yum! I now know how to calculate the volume of a solid.
Harry.

Sunday, May 24, 2009

Making Pikelets


What better way to learn about volume and mass for Maths than baking. This time it was pikelets. We divided the class into 4 groups. Two groups baked this week and the other two groups will bake next week. Everyone in the class will eat pikelets each time. What a yummy way to spend a wet Wednesday afternoon!

Wednesday, April 8, 2009

Making Rice Bubble Cakes


Mass, Capacity and Volume

Our new topic is Mass, Capacity and Volume
To start we brainstormed what we thought the words meant and wrote some of the symbols used when measuring volume.We found out that grams (g) and kilograms (kg) are the measurement used for weight. Litres (l) and mililitres (ml) are used to measure liquids.

We then made Rice Bubble Cakes and had to measure and weigh the ingrediants.
We were learning to
*recognise a 100 gram mass
*record measurements in kg and g using decimal notation
*accurately measure specific amounts of materials.

Monday, April 6, 2009

Statistics Reflections

Statistics Reflections
My favourite graph was the strip graph because it is quick, easy to understand, and it can be turned into a bar graph! This is a good way to learn about two different graphs
in a fun way!
By Ali

I now know how to view data on strip graphs,pie charts and line graphs! I have had loads of fun learning about staistics and have learnt lots about it.By Lili.

It has been fun using all different strategies and also statistics,I can figure more things out with statistics and I love using the bar graph to see who likes more and likes less.Everything in maths in Room 1 can be easy,challenging and the best thing about it,is it is FUN!!!!!!
By Bryn.

A new thing I have learnt is how to do a dot plot, stem&leaf graph and a strip graph.
By Harry.

My favourite graph is a strip graph because you can turn it into a bar graph.
By Bradley.

My favourite graph is a dot plot beacause it is quick and easy. By Oliver

I now know how to use a pie, stem and leaf and line graph and present them in my work.
By Seamus.

My favourite graph was the strip graph because you could cut it up and turn it into a bar graph.
by Matt.M

Tuesday, March 10, 2009

Probability

Seamus and Solomon were working on probability in statistics. They made a graph on Microsoft Excel to see what dice number they were more likely to roll.They had to roll the dice 40 times then put the results on a tally chart before putting them on the graph. The results were:0,2s 5,3s 3,4s 5,5s 0,6s 10,7s 7,8s 4,9s 4,10s 3,11 2,12s.
By Seamus and Solomon


For Statistics today we had to write on the board how long we watched TV for on Tuesday night.Four people watched none while three watched over four hours of TV.The average amount of time was between one and two hours. We put the information on a stem and leaf graph.
Lili and Jody

Statistics Learning


Room 1 has been learning about statistics(maths)here are our goals:
*understand when to use stem and leaf graphs, strip graphs, dot plots, pictographs
*ask a question to investigate
*collect and display data using a suitable graph
*write about what our results have told us and maybe take action.

by Barney